A login link has been sent to your inbox. If it doesn't arrive in 3 minutes, be sure to check your spam folder.
Understanding crypto charts might seem overwhelming at first, but technical indicators are powerful tools that help you make more informed trading decisions. Rather than guessing market moves, you can use these indicators to identify trends, time entries, and manage risk effectively.

In this guide, we’ll break down five of the most popular technical indicators, and show you how to actually apply them in real trading scenarios.
What it is: Moving Averages (like the 20, 50, or 200 MA) are lines that show the average price over time. They help you see if the market is trending up, down, or sideways
How to use it:
Tip: Avoid trading against the trend. Use MAs to stay on the right side of the market. For example, if the price is consistently above the 200 MA and supported by a rising 20 MA, it’s safer to look for long (buy) setups.
What it is: RSI helps determine whether a crypto asset is overbought or oversold, based on recent price movements. It ranges from 0 to 100.
How to use it:
Tip: Look for buying opportunities when RSI drops below 30 and aligns with a price support area. Confirm with price action before entering a trade.
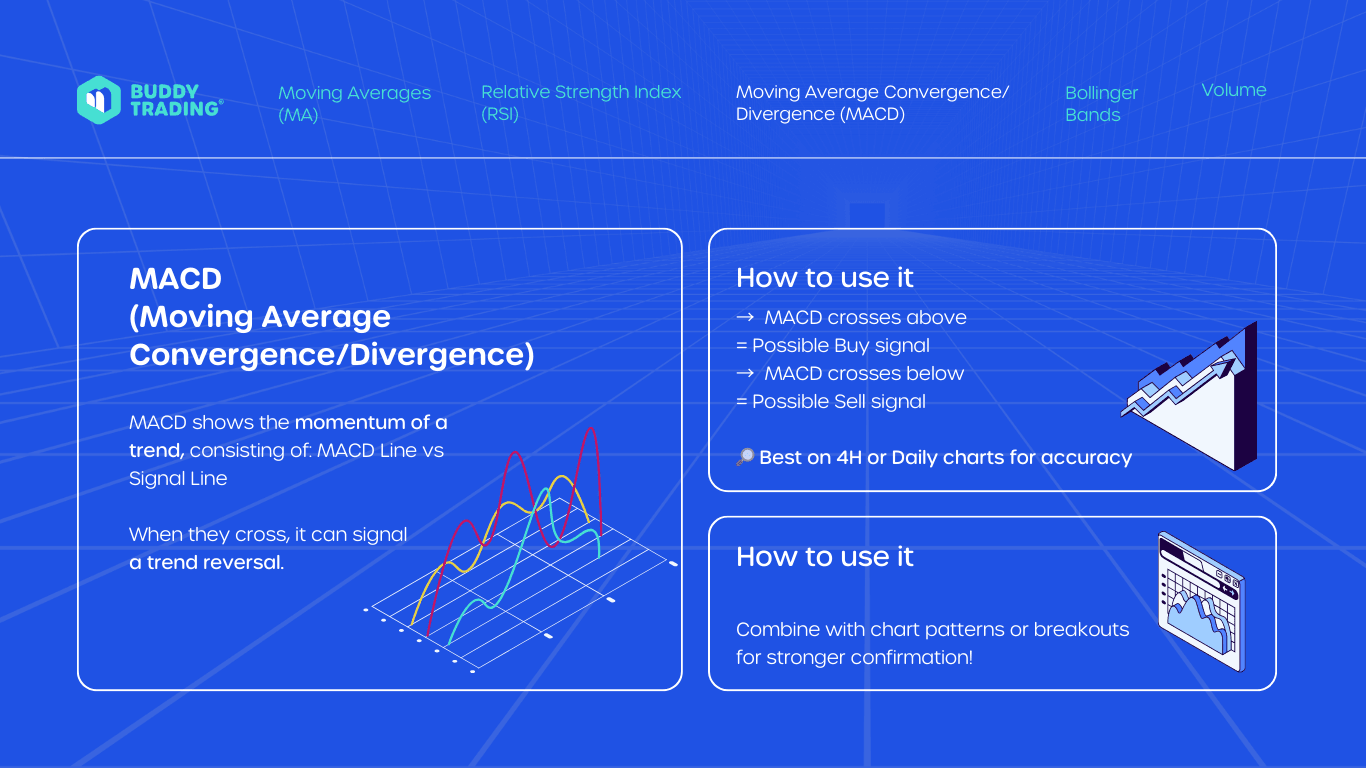
What it is: MACD (Moving Average Convergence/Divergence) shows the momentum of a trend. It consists of two lines:
When they cross, it can signal a trend reversal.
Tip: Combine MACD crossovers with confirmation from chart patterns or breakouts to avoid false signals.
What it is: Bollinger Bands consist of a middle moving average and two bands that expand or contract based on market volatility.
How to use it:
Tip: In sideways markets, you can use the bands to time entries and exits - buy near the lower band and sell near the upper one. In trending markets, wait for a breakout beyond the bands, backed by strong volume.
What it is: Volume measures how much of a crypto asset is being traded during a specific time period.
How to use it:
Tip: Before entering a trade on a breakout, check if volume is increasing. This adds conviction and reduces the chance of a false breakout.
As a beginner, you don’t need to master every indicator. Start by picking two or three and learn how they work together. For example:
The key is to avoid trading on a single indicator alone. Instead, layer them for stronger, more reliable signals.
Technical indicators don’t predict the future - but they can dramatically improve your decision-making when used correctly. Practice with small trades or demo accounts, track what works, and refine your strategy as you go.
When you’re ready, BuddyTrading provides an intuitive platform where you can test these indicators directly - or even follow top traders who already use them effectively.
📢 Join the BuddyTrading community today!
🌐 Visit us: BuddyTrading.com
🐦 Follow us: @BuddyTradingApp
💬 Stay updated: https://t.me/BuddyTradingApp
🚀 Stay ahead with expert insights & real-time updates!

Subscribe to our newsletter and be the first to access exclusive content and expert insights.

Compare copy trading platforms in 2025. Learn where quant traders, bot creators, algo strategy builder can monetize strategies and maximize profit share.

Learn how to promote your crypto trading bot with social selling from a marketing approach. Use GitHub, Discord, X, Reddit, and BuddyTrading to build trust and monetize strategies

You’ve probably seen debates online about whether overfitting can sometimes be “useful.” Let’s clear this up: **in crypto trading strategies, overfitting is always bad.** Why? Because an overfit model memorizes quirks of past price data instead of learning a true, repeatable edge. That’s how you end up with strategies that look like money-printing machines in backtests but collapse the second you go live.


