Understanding crypto charts might seem overwhelming at first, but technical indicators are powerful tools that help you make more informed trading decisions. Rather than guessing market moves, you can use these indicators to identify trends, time entries, and manage risk effectively.
In this guide, we’ll break down five of the most popular technical indicators, and show you how to actually apply them in real trading scenarios.
1. Moving Averages (MA): Identify Market Trends
What it is: Moving Averages (like the 20, 50, or 200 MA) are lines that show the average price over time. They help you see if the market is trending up, down, or sideways
How to use it:
Use the 200 MA on the 1-hour or 4-hour chart.
If the price is above the line = uptrend → look for buying setups.
If the price is below = downtrend → avoid buying or consider shorting.
Add a 20 MA for faster moves. When it crosses above the 200 MA, it could signal the start of a new trend (called a Golden Cross).
Tip: Avoid trading against the trend. Use MAs to stay on the right side of the market. For example, if the price is consistently above the 200 MA and supported by a rising 20 MA, it’s safer to look for long (buy) setups.
2. Relative Strength Index (RSI): Measure Momentum
What it is: RSI helps determine whether a crypto asset is overbought or oversold, based on recent price movements. It ranges from 0 to 100.
Above 70 = possibly overbought (too expensive)
Below 30 = possibly oversold (too cheap)
How to use it:
If RSI is below 30 and price is near a support zone, it might be a good chance to buy the dip.
If RSI is above 70 and the price looks exhausted or near resistance, consider taking profits or waiting.
Tip: Look for buying opportunities when RSI drops below 30 and aligns with a price support area. Confirm with price action before entering a trade.
3. MACD: Spot Trend Reversals
What it is: MACD (Moving Average Convergence/Divergence) shows the momentum of a trend. It consists of two lines:
The MACD line
The Signal line
When they cross, it can signal a trend reversal.
How to use it:
Look for the MACD line crossing above the Signal line = possible buy signal
Cross below = possible sell signal
Use it on longer timeframes (4H or daily) for more accurate results.
Tip: Combine MACD crossovers with confirmation from chart patterns or breakouts to avoid false signals.
4. Bollinger Bands: Gauge Volatility
What it is: Bollinger Bands consist of a middle moving average and two bands that expand or contract based on market volatility.
How to use it:
If the price touches the lower band, it may be oversold → consider buying.
If it touches the upper band, it may be overbought → consider selling or waiting.
When the bands squeeze (get tight), expect a big move soon - breakouts often follow.
Tip: In sideways markets, you can use the bands to time entries and exits - buy near the lower band and sell near the upper one. In trending markets, wait for a breakout beyond the bands, backed by strong volume.
5. Volume: Confirm Market Strength
What it is: Volume measures how much of a crypto asset is being traded during a specific time period.
How to use it:
If a breakout (above resistance or below support) happens with high volume, it's likely real.
If volume is low, be cautious - it might be a fake move.
Tip: Before entering a trade on a breakout, check if volume is increasing. This adds conviction and reduces the chance of a false breakout.
As a beginner, you don’t need to master every indicator. Start by picking two or three and learn how they work together. For example:
Use Moving Averages to identify trend direction
Combine RSI for timing entry based on momentum
Use volume to confirm the strength of the move
The key is to avoid trading on a single indicator alone. Instead, layer them for stronger, more reliable signals.
Technical indicators don’t predict the future - but they can dramatically improve your decision-making when used correctly. Practice with small trades or demo accounts, track what works, and refine your strategy as you go.
When you’re ready, BuddyTrading provides an intuitive platform where you can test these indicators directly - or even follow top traders who already use them effectively.
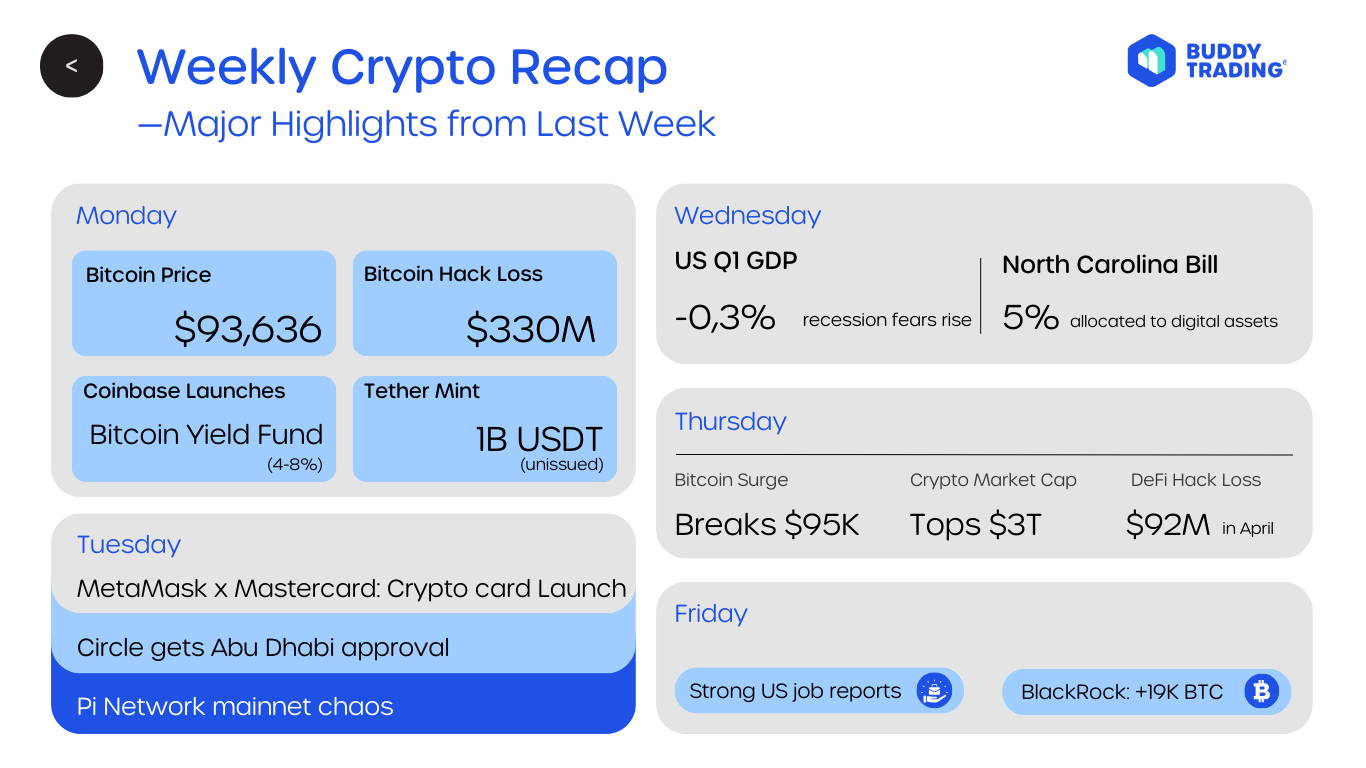
The first week of May delivered another rollercoaster for crypto investors. Bitcoin extended its rally, crossing impressive price milestones, while the overall crypto market surged past the $3 trillion mark for the first time since February, signaling renewed bullish sentiment.
Crypto markets are famously volatile, prices can soar or crash within minutes. While this can feel intimidating, experienced traders know volatility isn’t the enemy - it’s an opportunity.
In this blog, we’ll break down what market volatility really is, why it happens, and most importantly, how you
Retail trading has opened the door for everyday investors to access the strategies of top-performing traders. On platforms like BuddyTrading, it’s easier than ever to connect your capital to experienced lead traders and let their decisions guide your trades. Sounds simple, right?
But for many beginners, retail trading can
 Our Blog

 3 min read